Sample work

A physics handout, before and after

We wrote a two page physics handout and exported it twice. The first file is untagged, the way many files reach us. The second is the remediated version. On screen they look the same. The difference is what a screen reader gets.

Open both files in PAC or with a screen reader such as NVDA and compare them. The handout was written by EulerDesk for this page, so you are free to use it for your own testing.

What changed

What assistive technology gets from each file
Part of the fileBeforeAfter
Title and languageNot setDocument title shown, language set to English
Headings and bookmarksNoneA heading for every section, plus bookmarks
EquationsDrawings with no text behind them, so a screen reader skips themTagged as formulas, each with spoken alt text
Figure 1, the graphSkippedAlt text that describes the curve and its key values
Table 1A run of numbers with no headersColumn and row headers linked to every cell
ListsPlain lines of textTagged lists, with numbers on the worked steps

The handout as a web page

This is the same handout in HTML. Here the equations are written in MathML, so screen readers that support math can read them aloud and let you move through them term by term.

Projectile Motion: the setup

A ball is launched from level ground with speed v₀ at an angle θ above the horizontal. If we ignore air resistance, the only force on the ball after launch is gravity, which pulls it down with acceleration g. The horizontal and vertical motions can then be treated separately.

Position at time t

The horizontal velocity never changes, so the horizontal position grows steadily with time:

x(t)=v0cos⁡θt

The vertical velocity starts at v₀ sin θ and falls at the rate g, which gives:

y(t)=v0sin⁡θt−12gt2

Three useful results

Setting y(t) = 0 gives the time of flight T. Putting T into x(t) gives the range R, and the top of the path gives the maximum height H.

  • Time of flightT=2v0sin⁡θg
  • RangeR=v02sin⁡2θg
  • Maximum heightH=v02sin2⁡θ2g
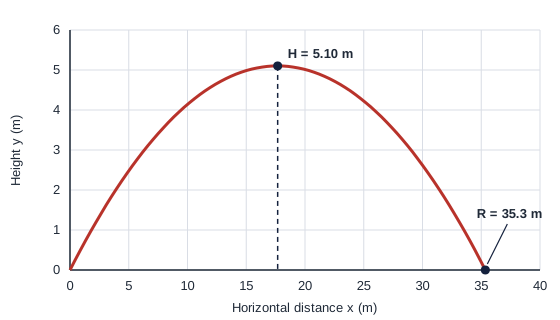
Graph of height against horizontal distance. A symmetric curve rises from the origin to a peak of 5.10 meters at a distance of about 17.7 meters, then falls back to the ground at 35.3 meters.
Figure 1. Path of a ball launched at 20 m/s and 30°. It reaches a maximum height of 5.10 m and lands 35.3 m away.

Worked example

A ball is launched at v₀ = 20 m/s and θ = 30°. Take g = 9.8 m/s². Find the time of flight, the range and the maximum height.

  1. Time of flight
    T=2×20×sin⁡30°9.8=2.04 s
  2. Range
    R=202×sin⁡60°9.8=35.3 m
  3. Maximum height
    H=202×sin2⁡30°2×9.8=5.10 m

Changing the launch angle

Table 1 keeps v₀ = 20 m/s and changes only the angle.

Table 1. Flight time, maximum height and range for v₀ = 20 m/s and g = 9.8 m/s²
Launch angleTime of flight (s)Maximum height (m)Range (m)
15°1.061.3720.4
30°2.045.1035.3
45°2.8910.240.8
60°3.5315.335.3
75°3.9419.020.4

Two things stand out. The range is largest at 45°, and angles that add up to 90°, such as 30° and 60°, give the same range. The higher angle keeps the ball in the air longer and sends it higher.

Try it yourself

  1. At what launch angles would the ball land 20.4 m away?
  2. If v₀ doubled, how would the range change?

Answers: 15° or 75°. The range would become four times larger.